In der FAQ-Datenbank suchen
Anwendung der Filter in DB Monitor
To launch DB Monitor, you can either:
- Double click on the DB Monitor icon, on your desktop or
- In RF Monitor, Click on Database / Measures
or
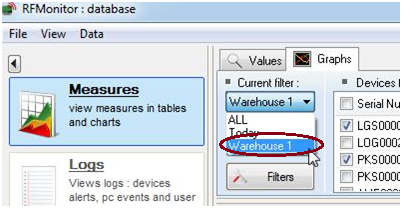
Use pre-existent filters
Select manually:
- The devices and the corresponding sensors you want to visualize
- Choose a period or define a custom period : you can directly write the time that you want to display
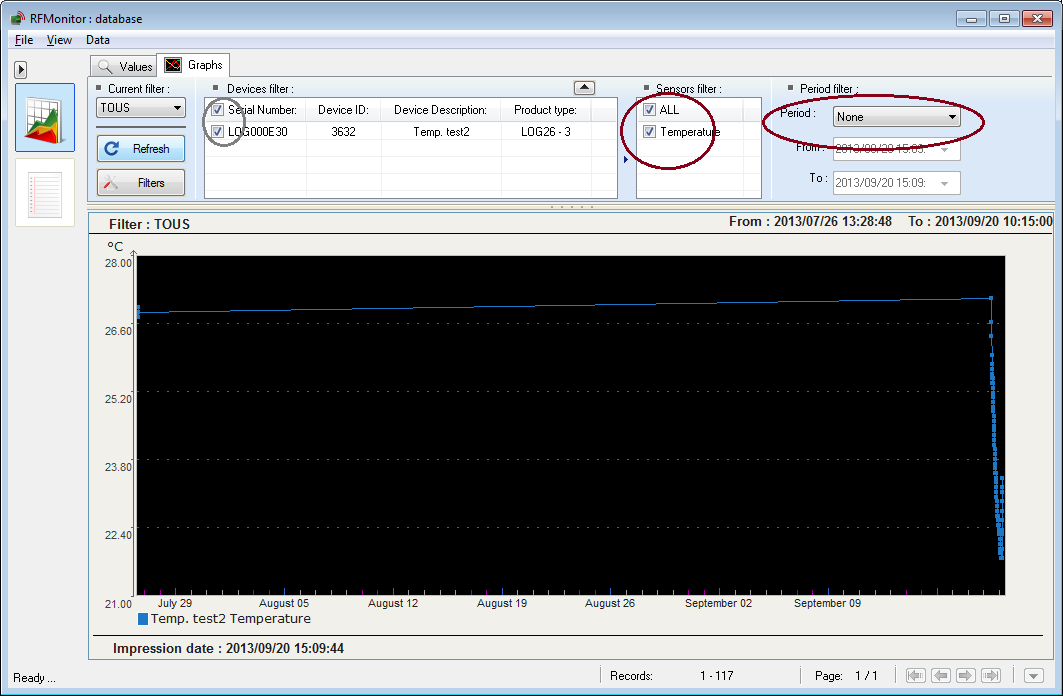
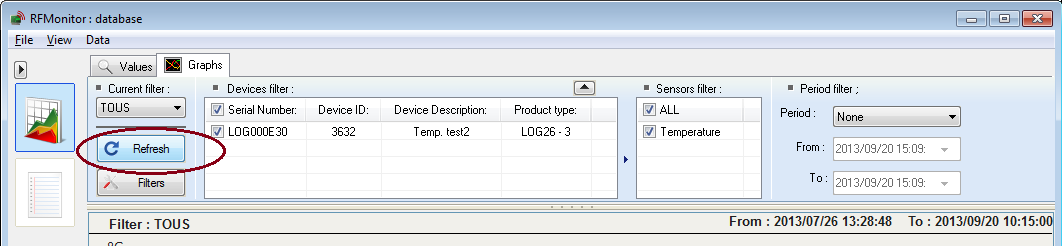
Click on Refresh
Create and save a custom filter
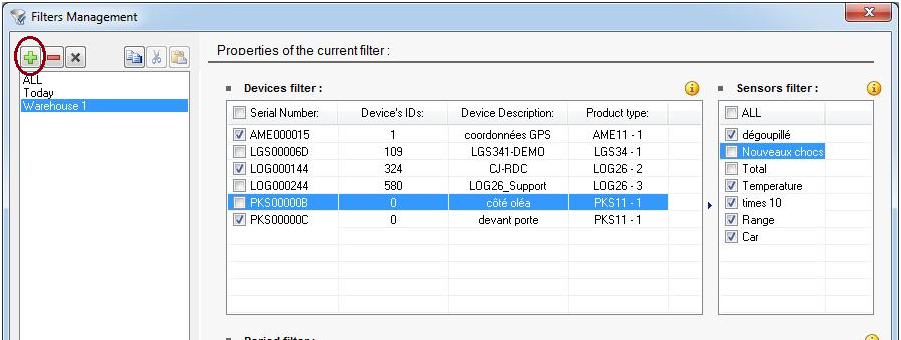
Click on the Filters button.
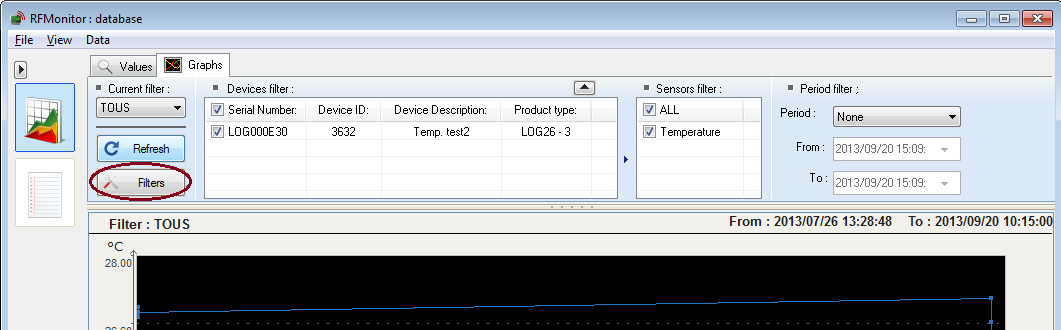
A new window opens.
Click on the green cross to add a new filter and give it a name.
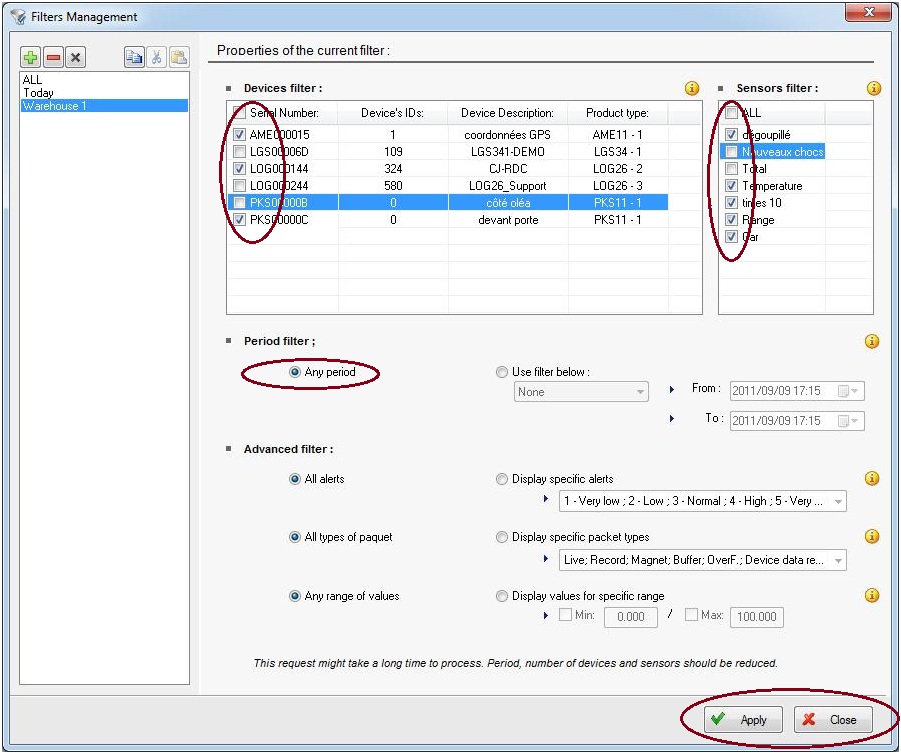
Select the devices and the corresponding sensors you want to visualize. Choose a period or define a custom period in “Period Filter”. Click on Apply then click on Close.
Use a custom filter
Select your filter in the Current filter menu ans click on Refresh.