Search the knowledge base
Ways to display measurements in RF Monitor
The RF Monitor software displays the measurements transmitted by loggers available in the network. Several views are available.
List of loggers and tabs
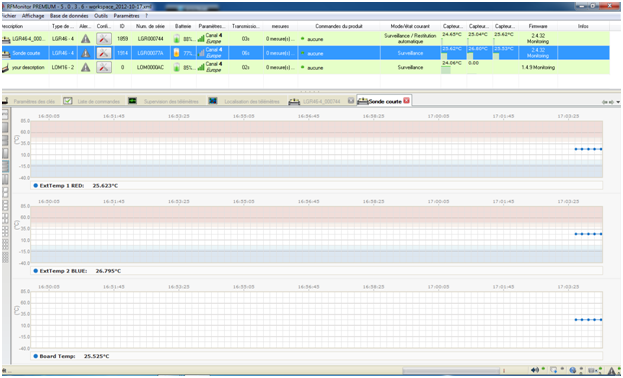
The list of products is displayed at the top with their battery level, the measurement … and under one tab for each logger with curves displaying the various measurements (in this example, three temperatures: 2 probes and one in the enclosure) .
Positioning on a map, an image
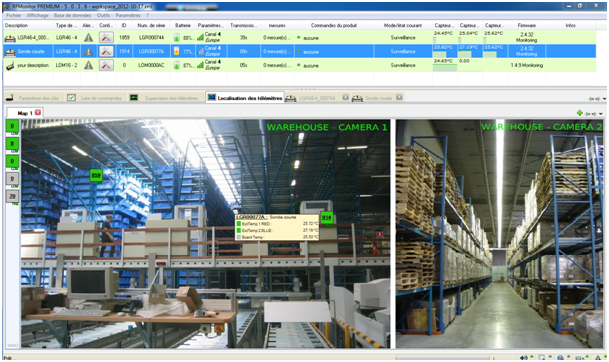
It is possible to embed a map, photo, and position the loggers on it. By moving the mouse on a logger, you get its last measurements.
Supervision tab
It is possible to display the measurements of different loggers on the same screen. Several presentations are possible. In the case below, we have the temperature of 3 different loggers.
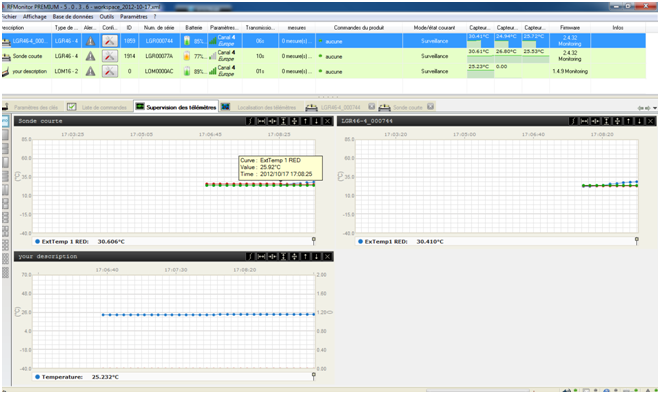
You can also change the layout of the curves by clicking on the icons located to the left of the screen.
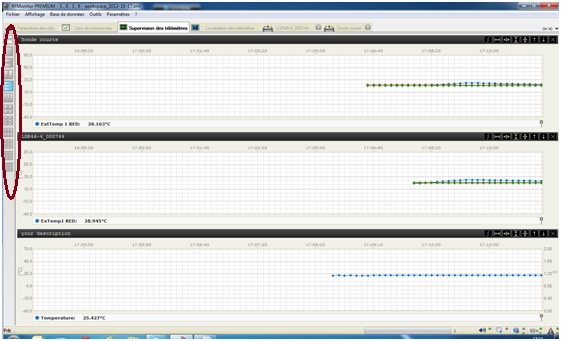
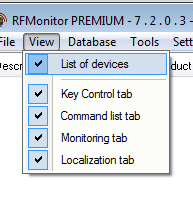
It is possible to make better use of the height of the screen displaying only the curves and removing the list of loggers. To do this, simply go to View menu and untick List of devices.
Through DBMonitor
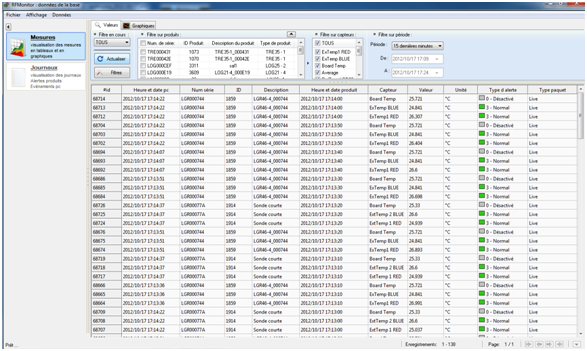
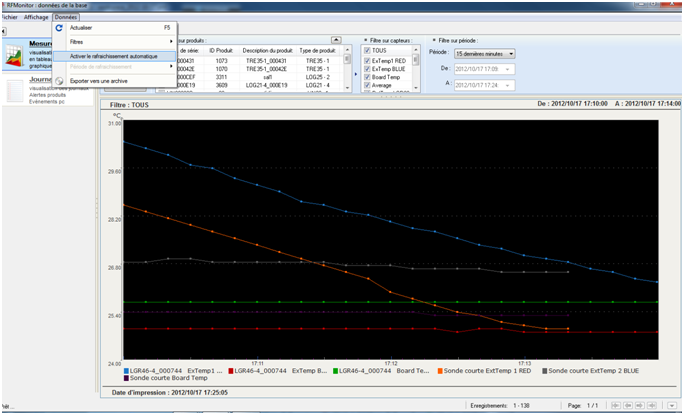
Another possible display: from the database, updating the automatic refresh. To do this, go to Database / Measures.

And then in the menu Data / Enable automatic refresh.
Measurements are displayed as curves…
… or as a listing.
